Debugging Transactions
Tip
Before using this tutorial, we recommend checking out the Debugger Tour for an overview of the debugger’s interface and panels.
When developing smart contracts, things don’t always behave as expected. A transaction might revert unexpectedly, a function might return the wrong value, or funds might not move the way you intended.
These are the situations where Remix’s debugger becomes essential. It lets you step through a transaction execution line by line, inspect local variables and state at each step, and pinpoint exactly where your contract’s logic breaks down.
In this tutorial, we’ll walk through using the debugger with a contract that has an intentional bug, so you can see how to identify and trace a problem through the execution flow.
Debugging a transaction made in Remix
We’ll use the following Donation contract as our example. Don’t worry about understanding every detail yet — we’ll be using the debugger to explore how it executes.
// SPDX-License-Identifier: MIT
pragma solidity ^0.8.0;
contract Donation {
    address owner;
    event fundMoved(address _to, uint _amount);
    modifier onlyowner { require(msg.sender == owner); _; }
    address[] _giver;
    uint[] _values;

    constructor() {
        owner = msg.sender;
    }

    function donate() public payable {
        addGiver(msg.value);
    }

    function moveFund(address payable _to, uint _amount) onlyowner public {
        uint balance = address(this).balance;
        uint amount = _amount;
        if (amount <= balance) {
            (bool success, ) = _to.call{value: balance}("");
            if (success) {
                emit fundMoved(_to, amount);
            } else {
               revert();
            }
        } else {
            revert();
        }
    }

    function addGiver(uint _amount) internal {
        _giver.push(msg.sender);
        _values.push(_amount);
    }
}
Make a new file in Remix and copy the code block above into it, compile it and deploy it on the Remix VM.
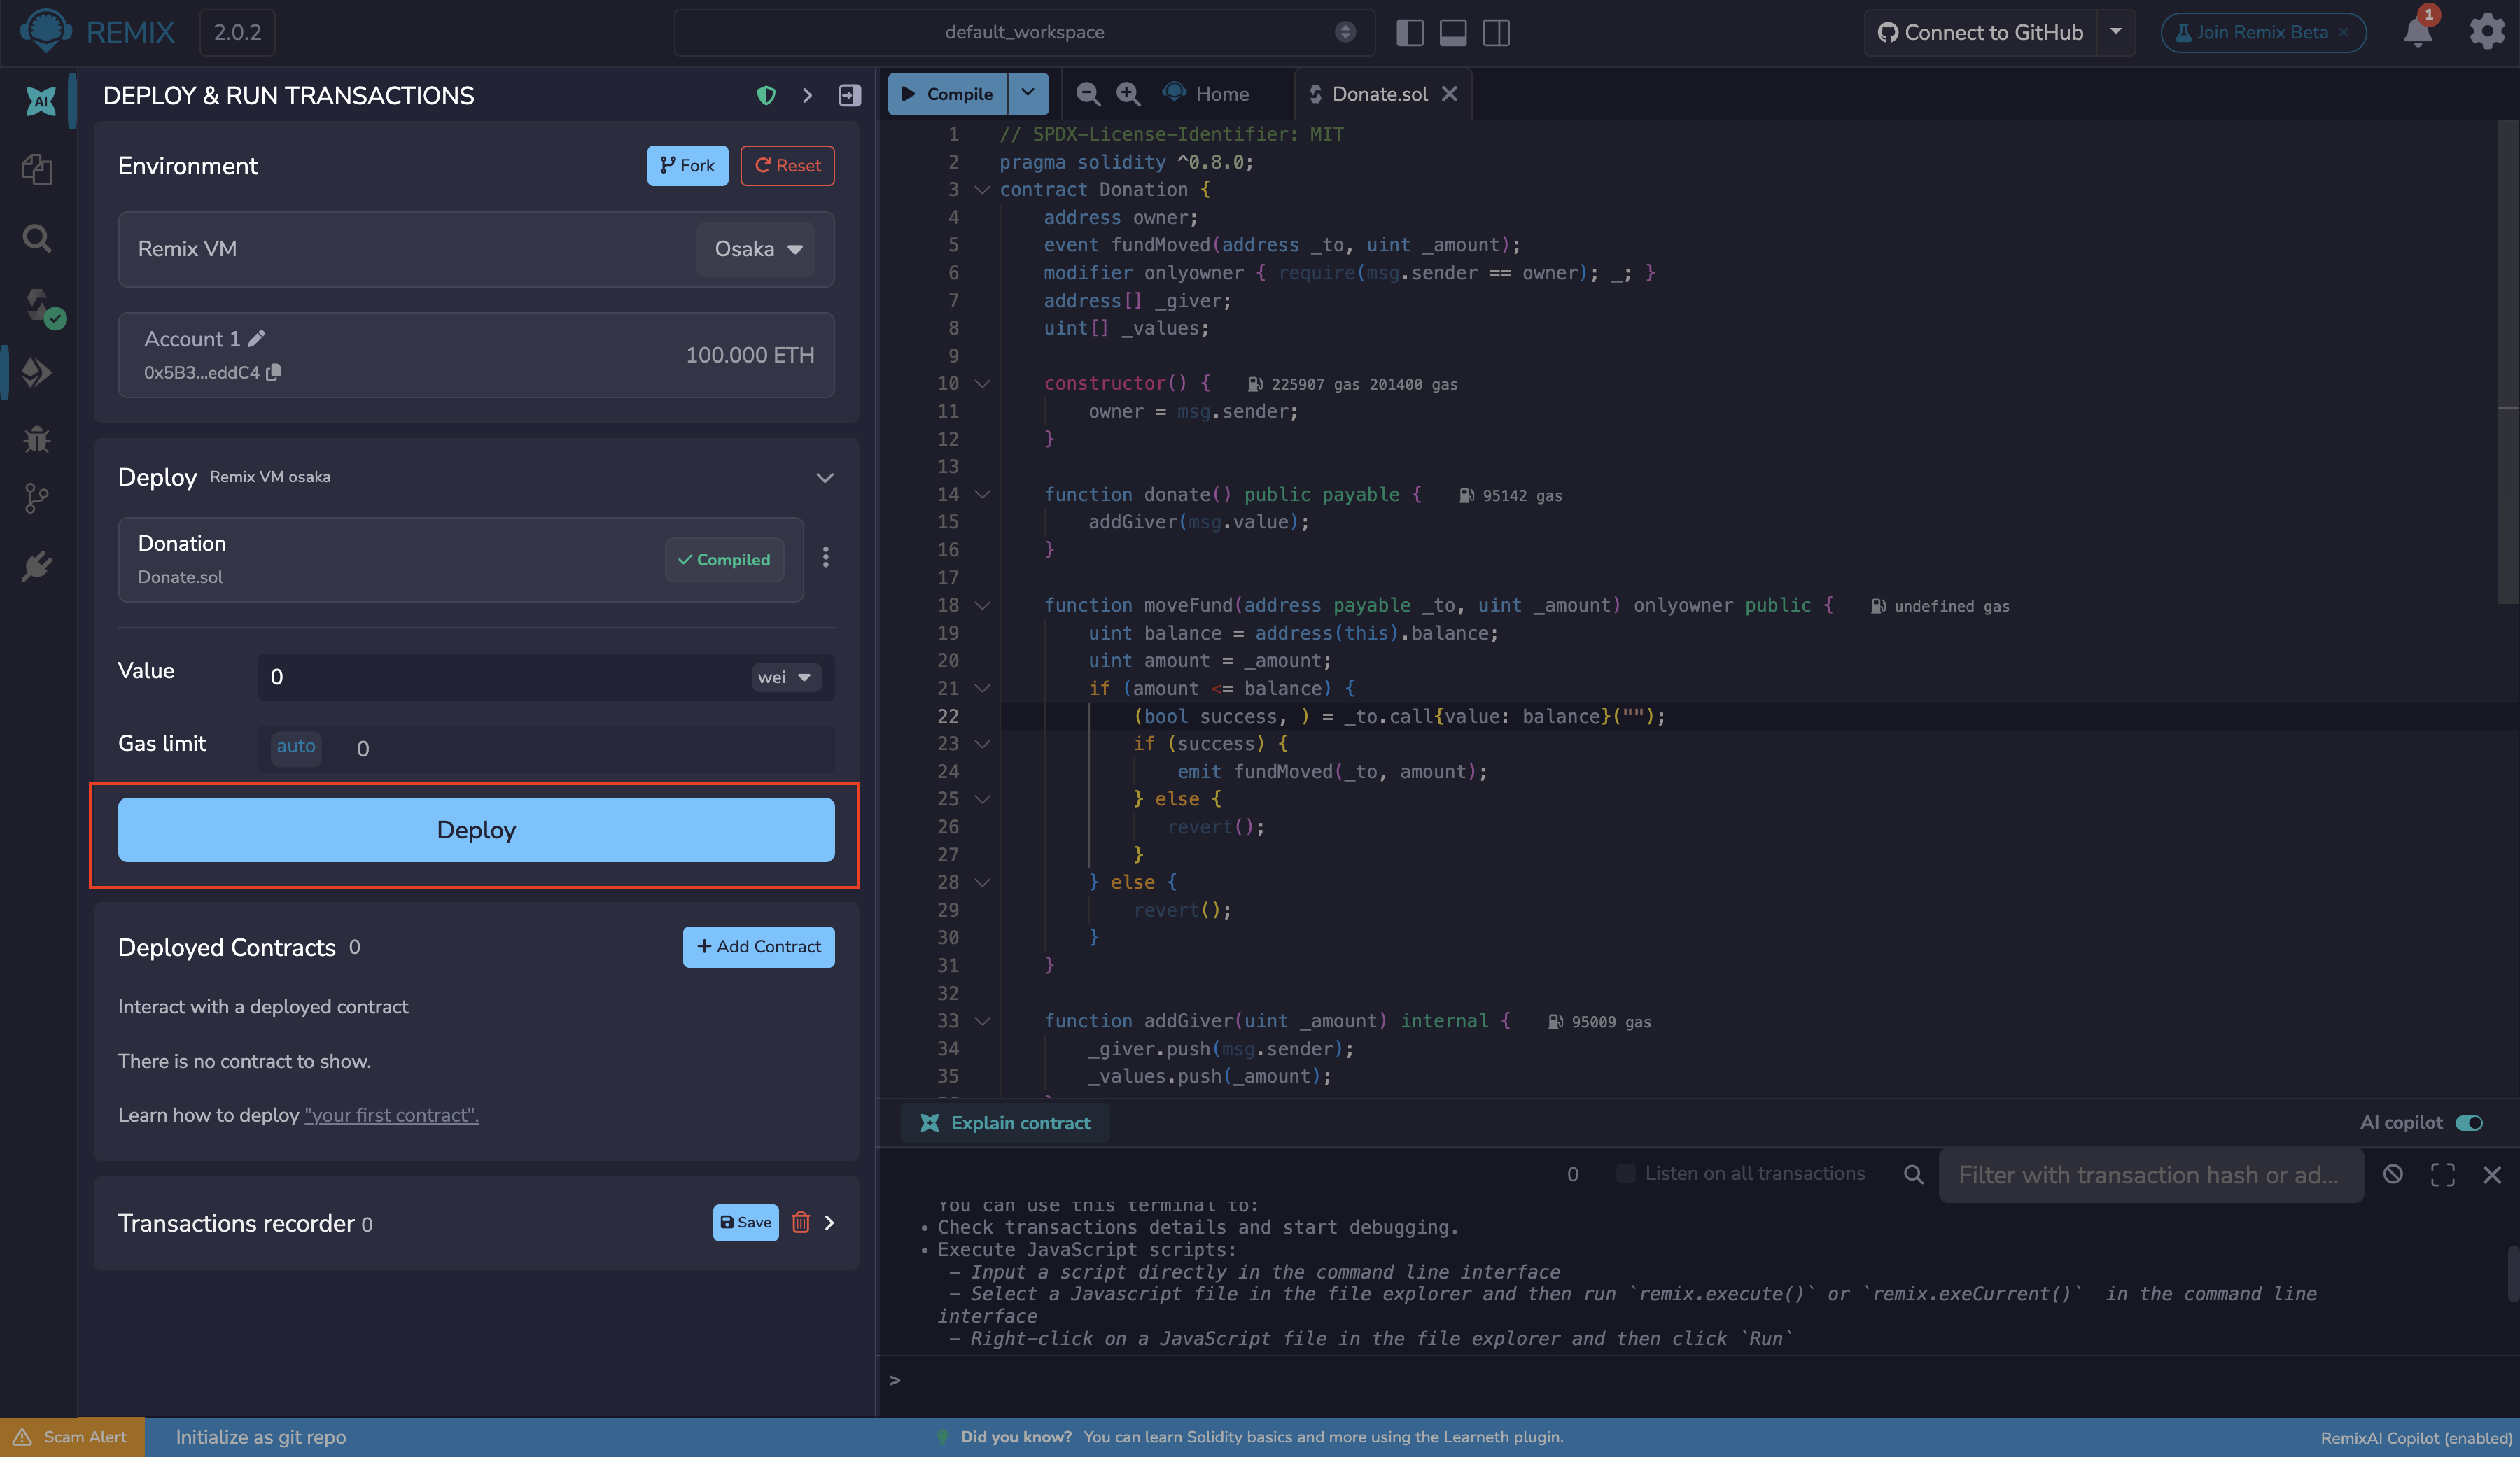
We are going to call the Donate function and will send 2 Ether.
To do this: in the value input box put in 2 and select Ether as the unit. Do not leave the default unit as gwei or the change will be hard to detect.
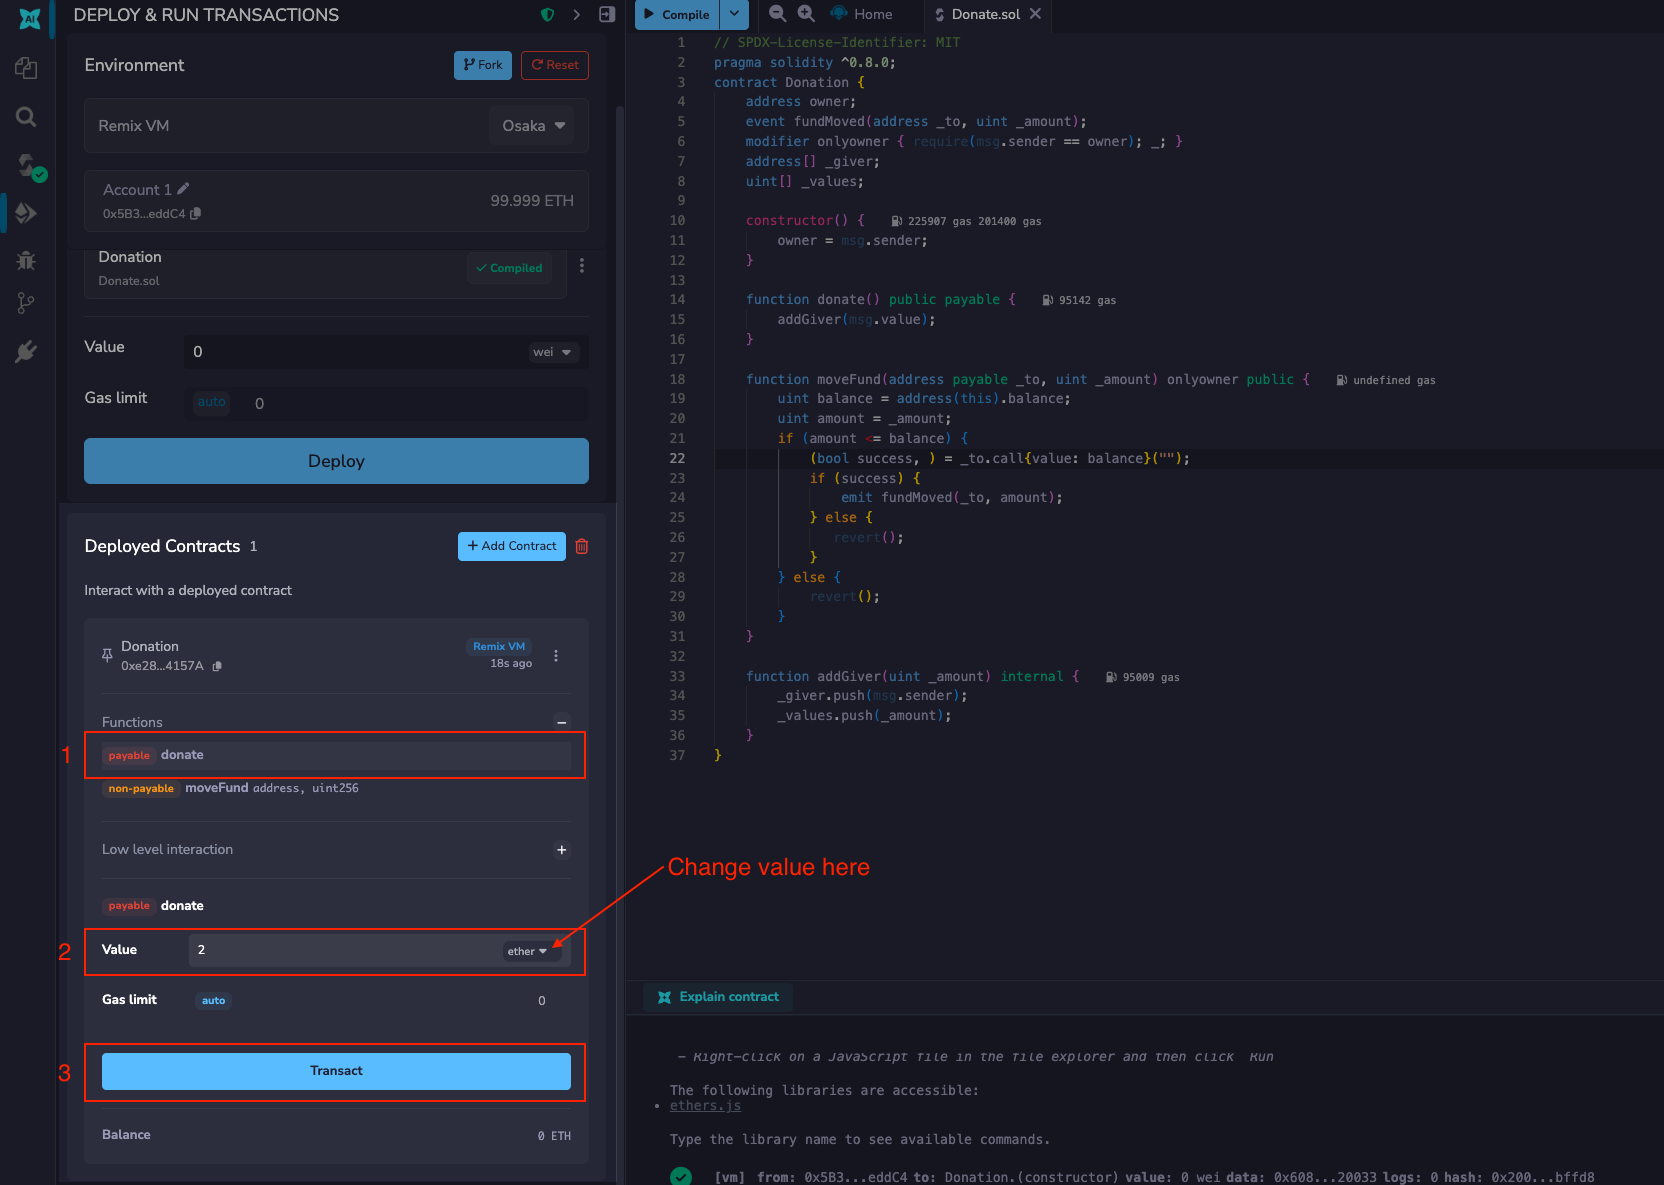
Then click the Donate button.
The 2 ETH is now held by the contract. Because we are using the Remix VM, the transaction confirms almost instantly.
Now let’s try to move 1 ETH out of the contract using moveFund. In the deployed instance, find the moveFund inputs and provide:
_to: a different address from the Account dropdown that did not calldonate. Use an account with a clean 100 ETH balance so the balance change is clearly visible. Copy the address, then switch back to the owner account to make the call._amount:1000000000000000000(1 ETH in wei)
Important
Before clicking moveFund, reset the Value field to 0. Remix keeps the value from the previous donate call. Since moveFund is not payable, sending ETH with the call will cause it to revert immediately.
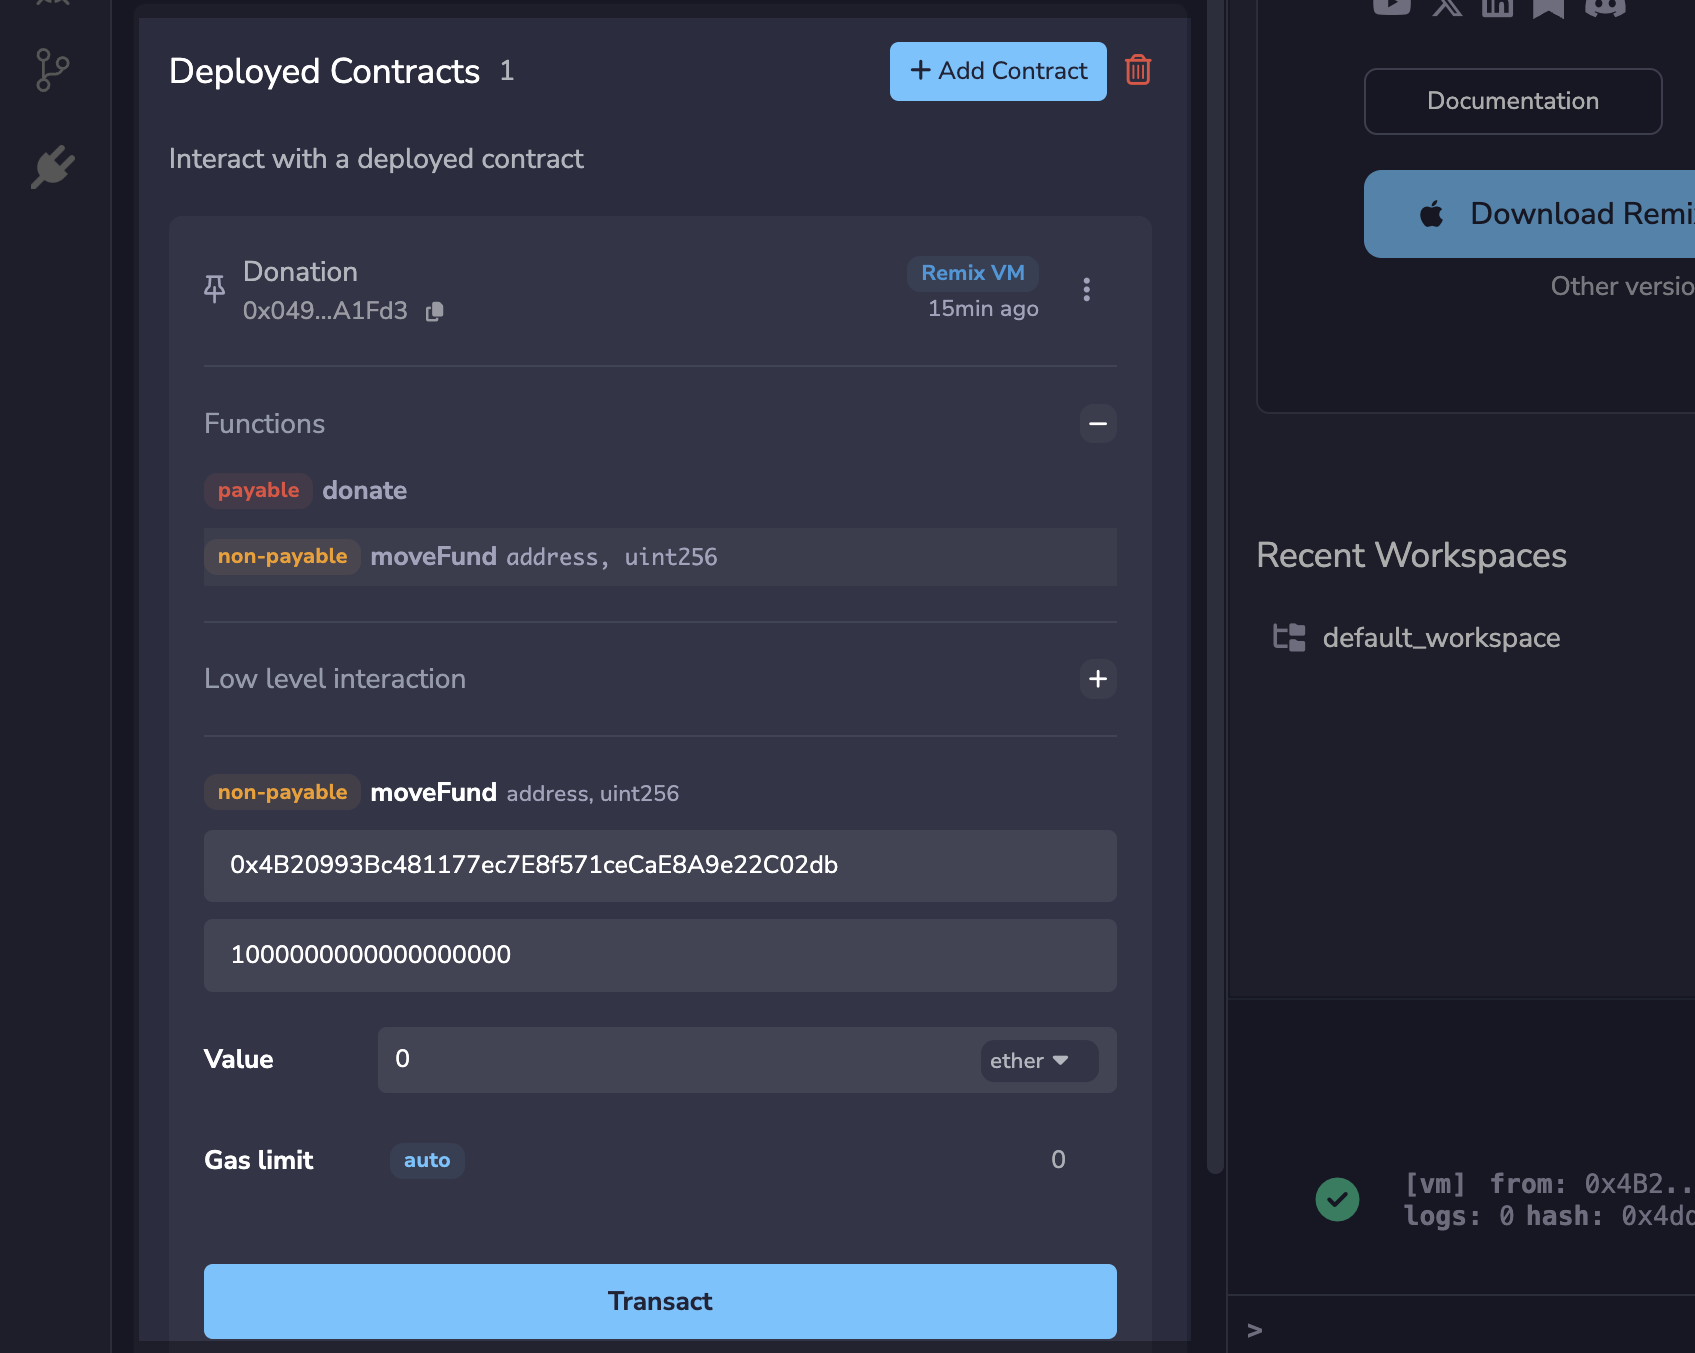
Click Transact.
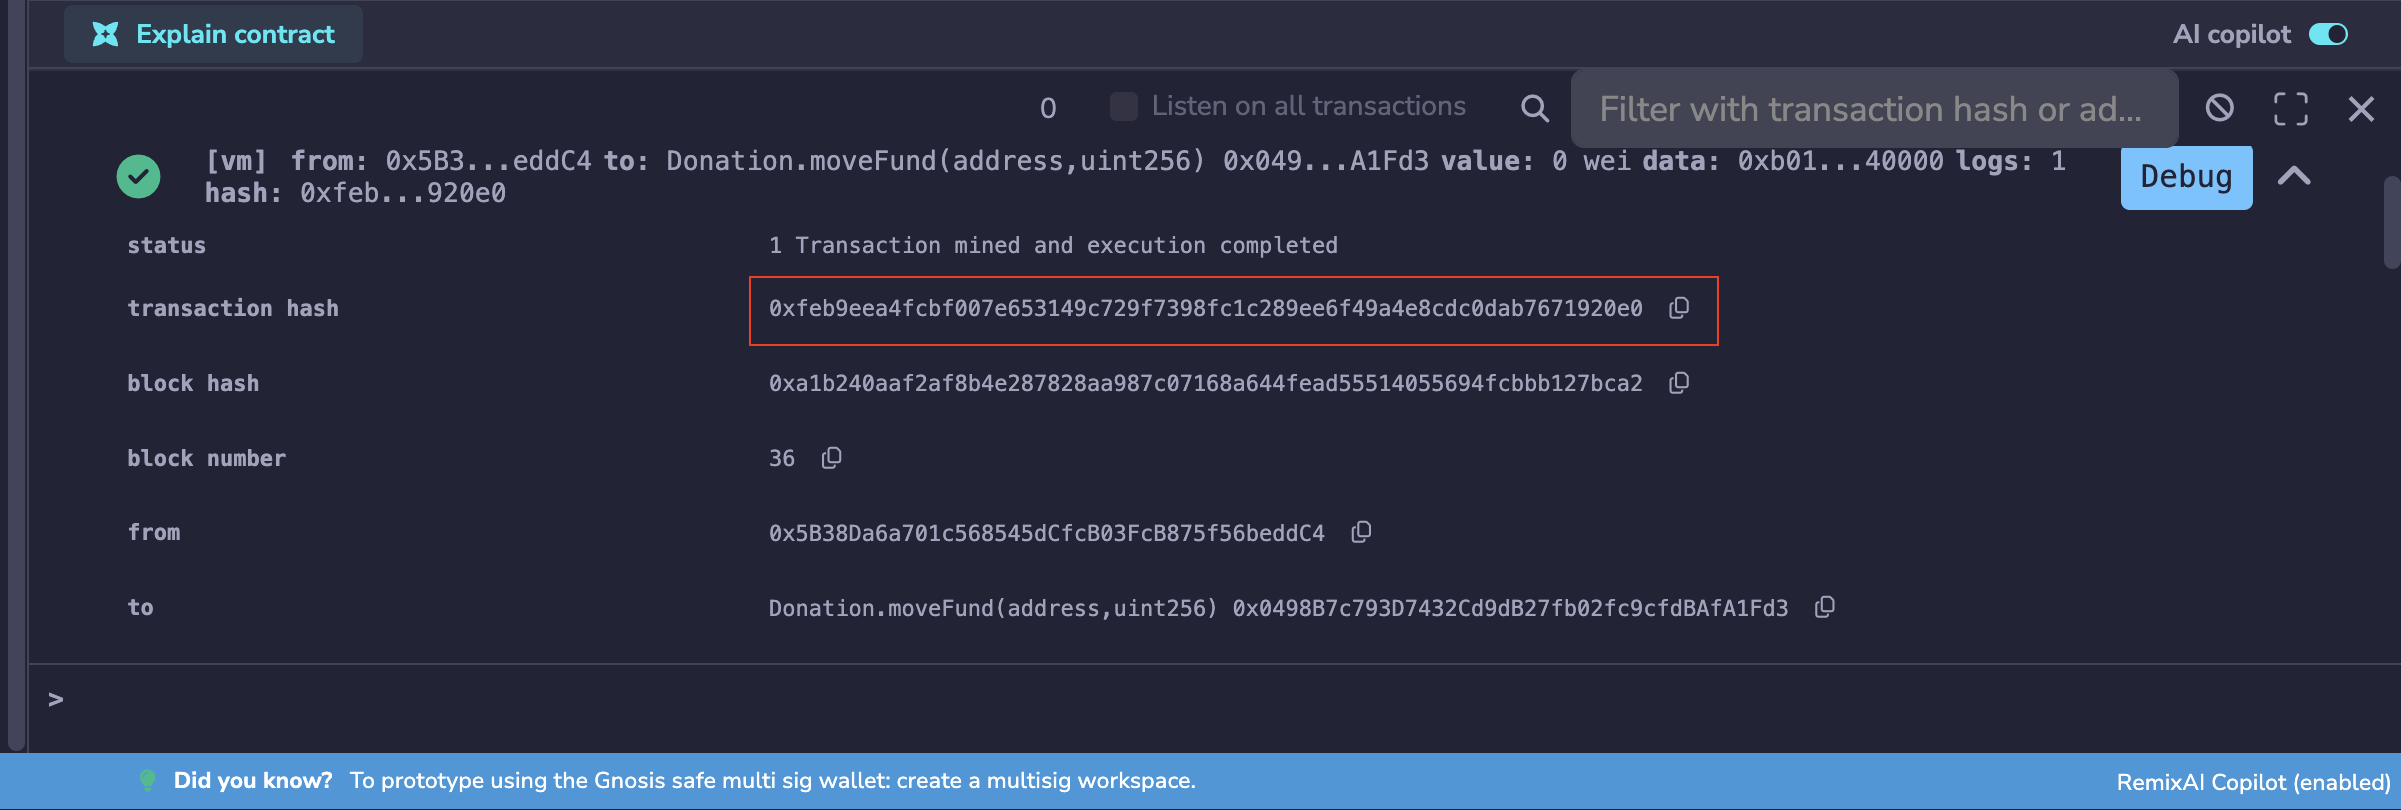
The transaction succeeds, but check the recipient’s balance by selecting their address in the Account dropdown. Instead of receiving 1 ETH, the entire 2 ETH contract balance was transferred. Something is wrong.
Notice also that the terminal log shows _amount: 1000000000000000000 (1 ETH) in the fundMoved event, matching what you requested. The event does not reveal the discrepancy because the contract emits amount (the requested value) rather than the amount actually sent. Without the debugger, the logs alone would not expose this bug.
In the terminal, find the moveFund transaction and click its Debug button.
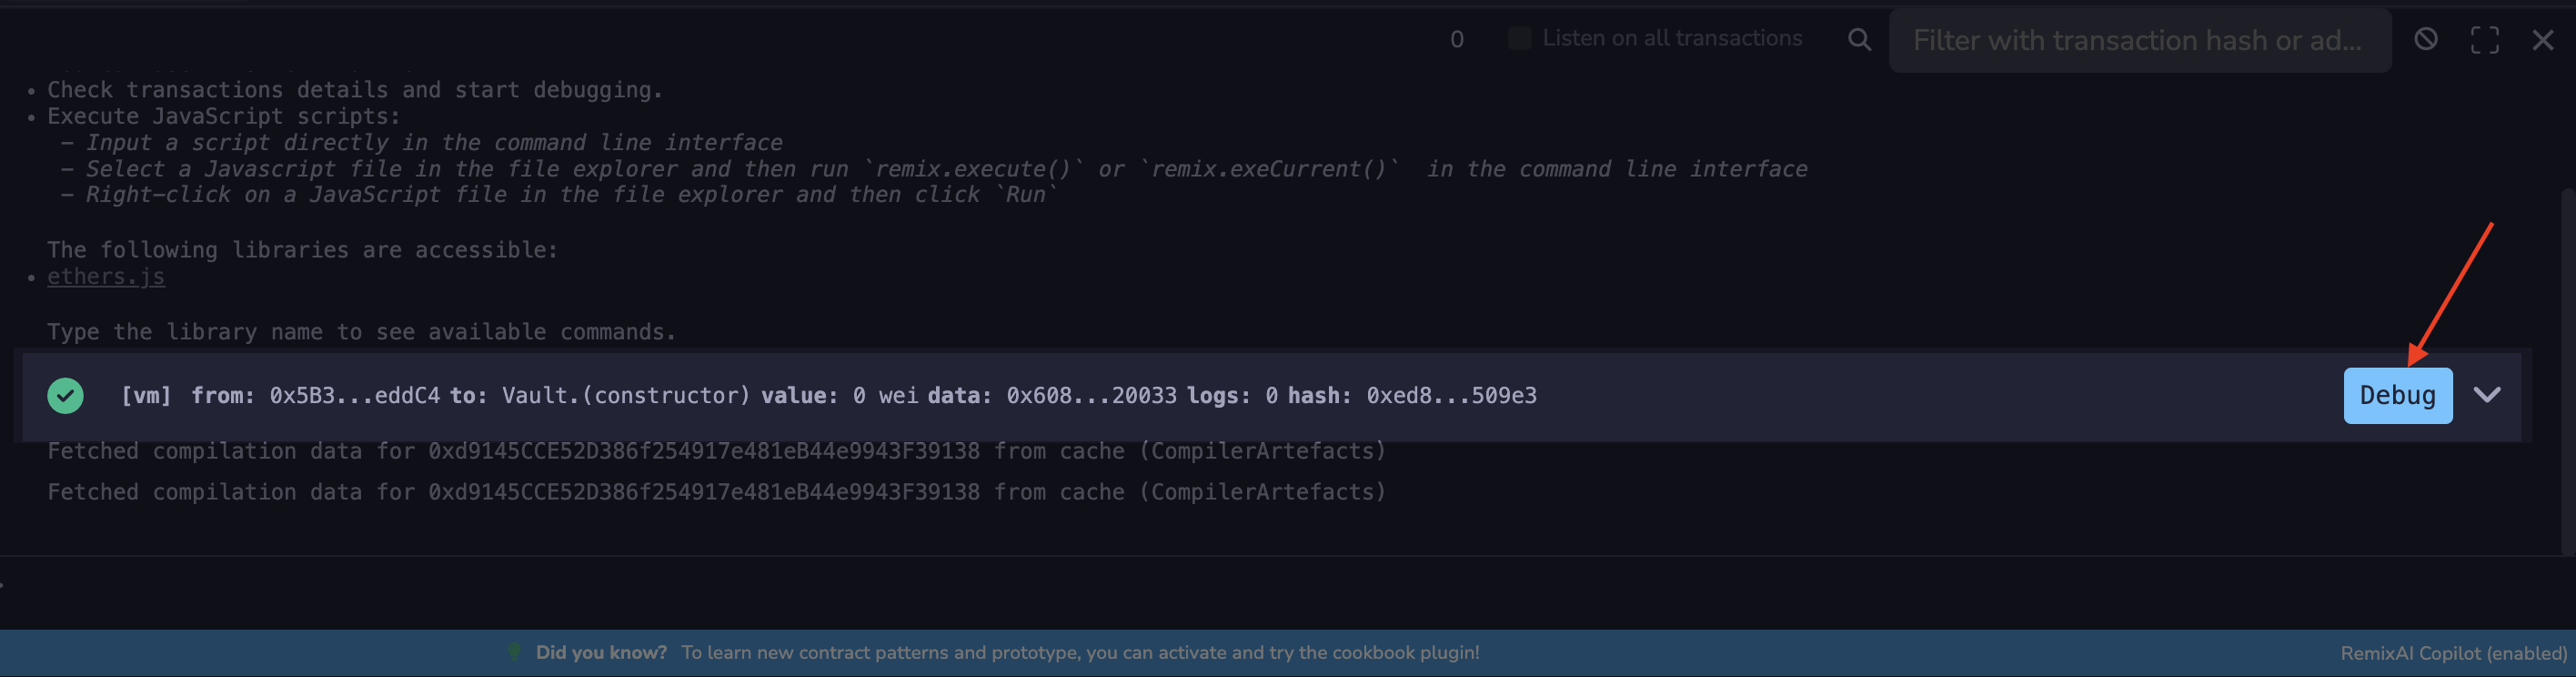
The debugger opens and highlights the current execution point in the editor. Use the Step Forward button to move forward through moveFund line by line.
As you step through the function, watch the State & Locals panel. You’ll see the local variables populate under the locals section as they are assigned:
_amount: the value you passed in:1000000000000000000(1 ETH in wei)balance: the full contract balance:2000000000000000000(2 ETH in wei)amount: assigned from_amount:1000000000000000000(1 ETH in wei)
Continue stepping until the debugger reaches the transfer line:
(bool success, ) = _to.call{value: balance}("");
At this point, look at the locals section of the State & Locals panel. The value being sent by the call is 2000000000000000000 (the full contract balance), not the 1000000000000000000 (1 ETH) you requested. The function is sending balance instead of amount. The check if (amount <= balance) used amount correctly, but the transfer itself did not.
To fix the bug, change balance to amount in the transfer line:
(bool success, ) = _to.call{value: amount}("");
This ensures only the requested amount is sent, not the entire contract balance.
Starting a debug session from the debugger panel
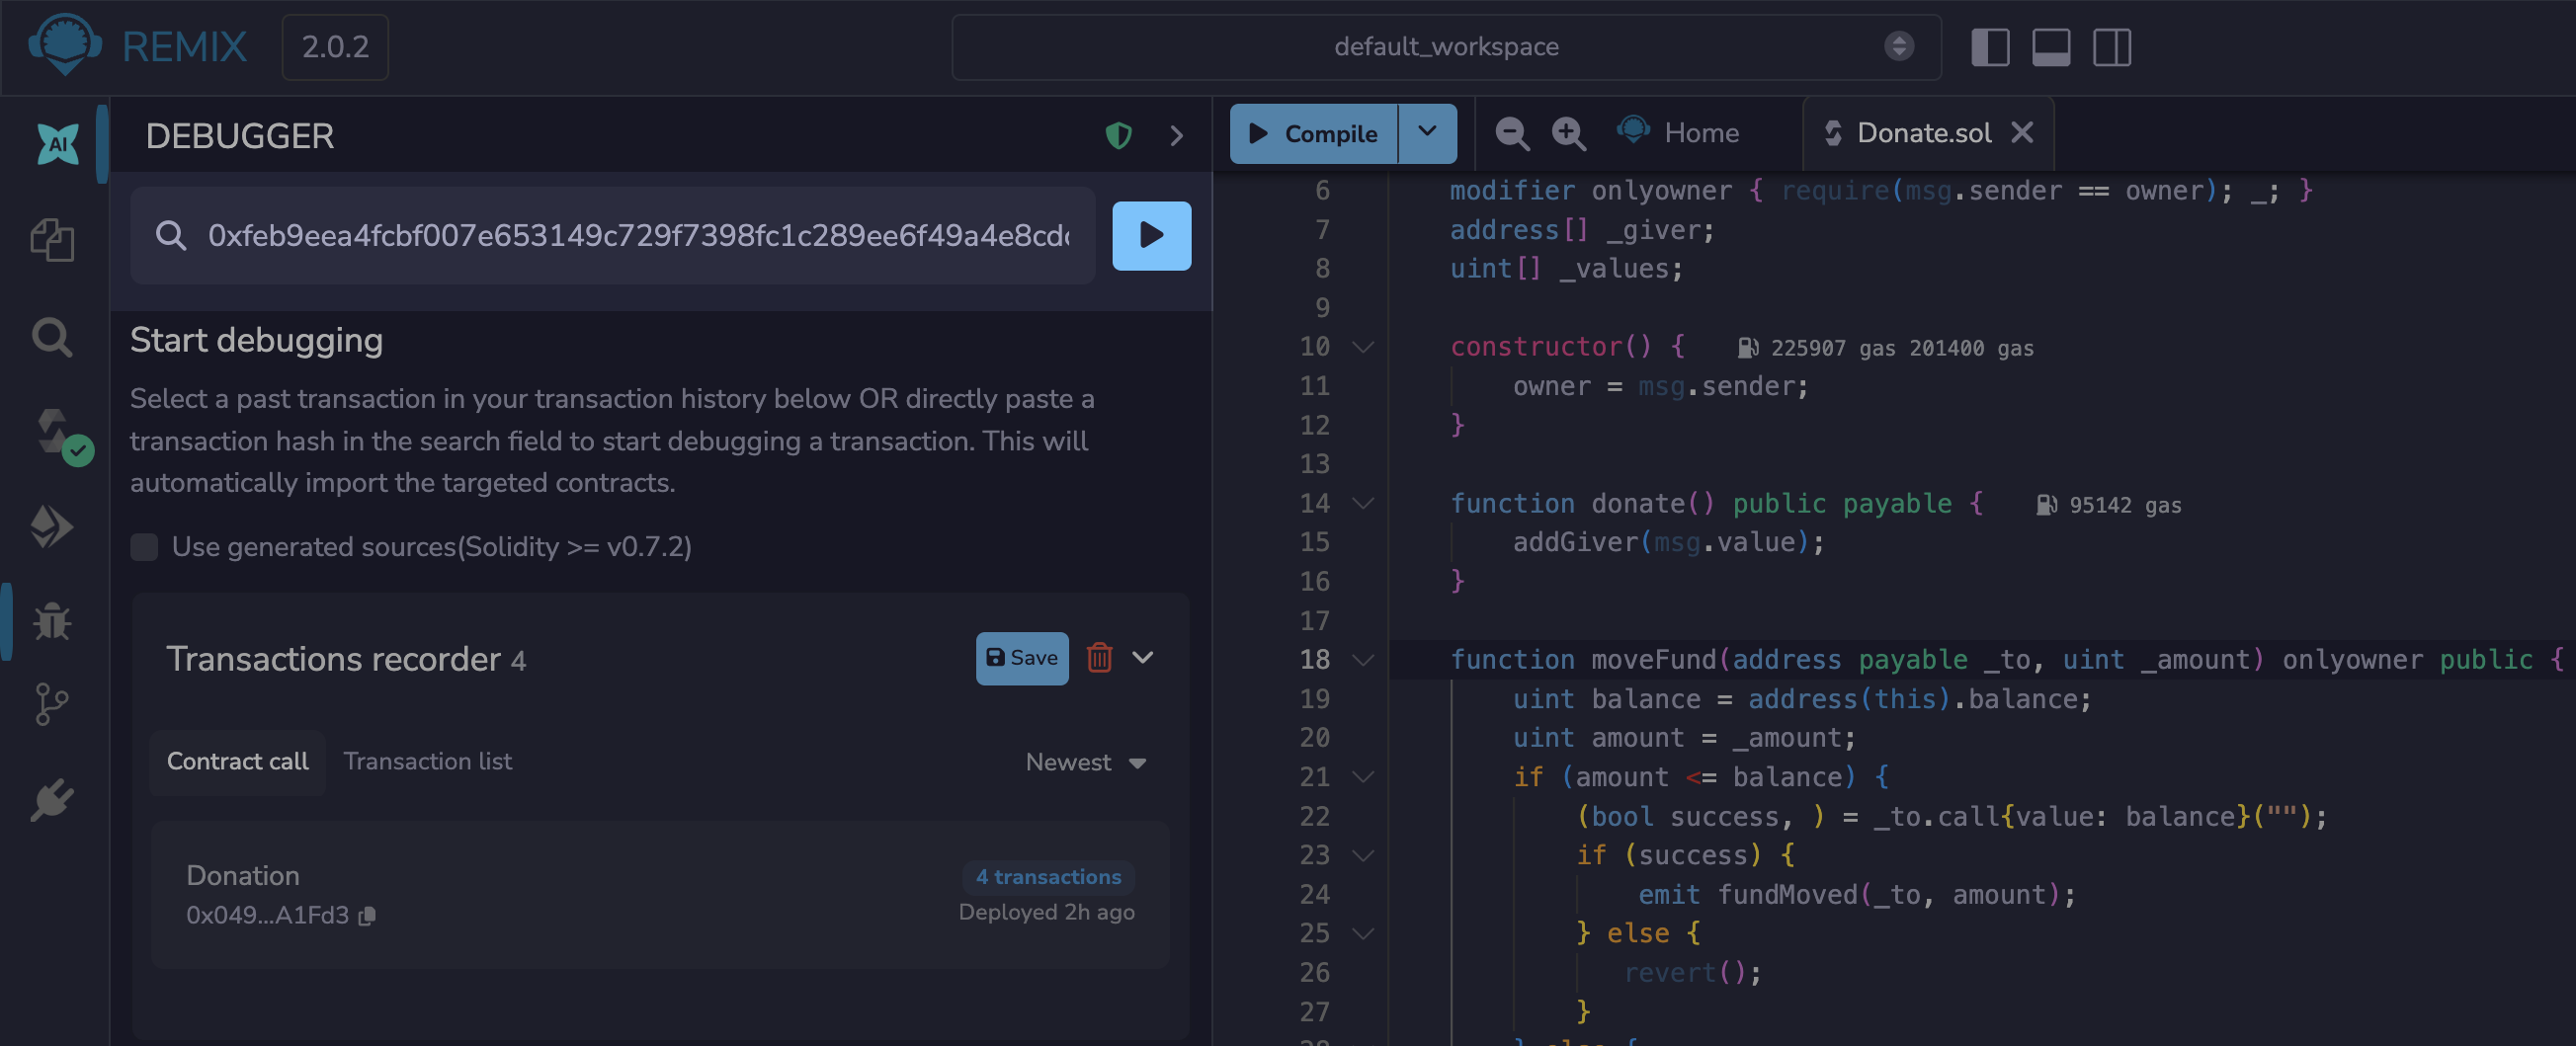
As an alternative to clicking Debug in the terminal, you can start a session directly from the Debugger panel using a transaction hash.
Click the bug icon in the Icon Panel to open the Debugger. If you don’t see the bug icon, activate the Debugger in the Plugin Manager.
To find a transaction hash:
Go to a transaction in the terminal.
Click a line with a transaction to expand the log.
Copy the transaction hash.
Paste the hash into the Debugger and click the button with the Play icon.
Using the debugger
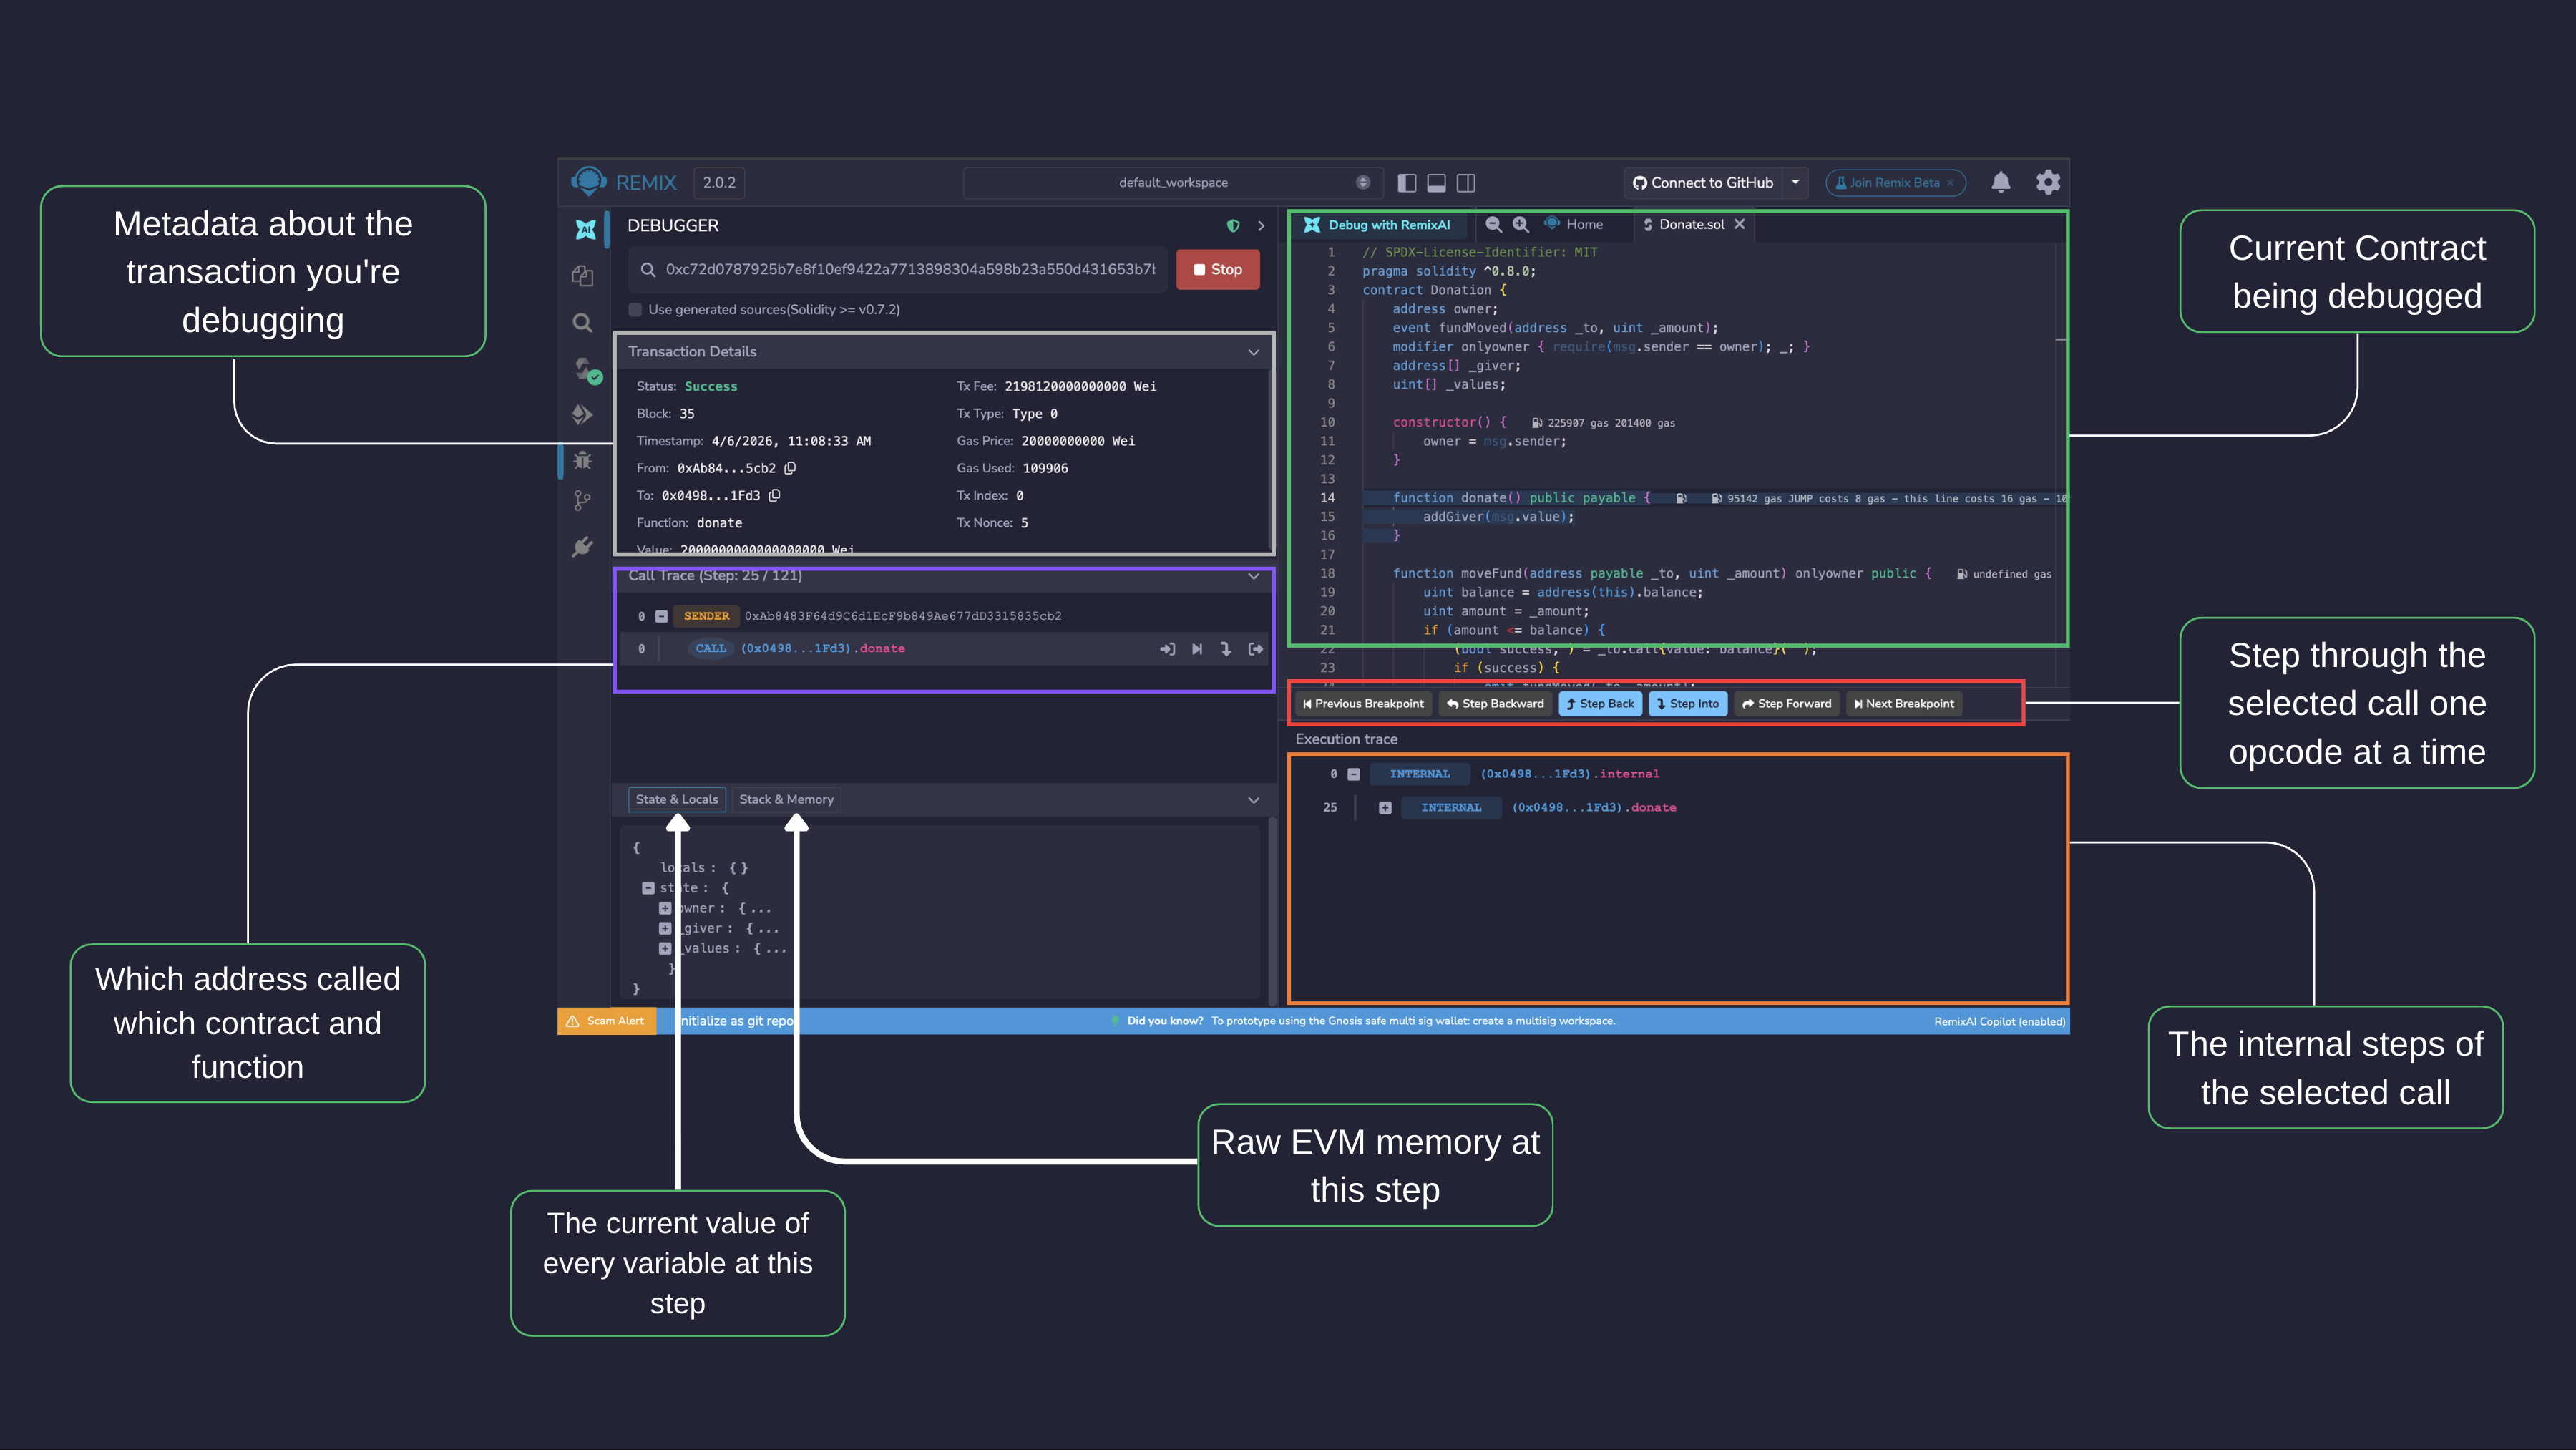
The debugger allows one to see detailed information about the transaction’s execution. It uses the editor to display the location in the source code where the current execution is.
The navigation part contains a slider and buttons that can be used to step through the transaction execution.
Debugger panels
State & Locals
The State & Locals tab displays a JSON object with two keys:
locals: the local variables in scope at the current execution stepstate: the state variables of the contract at the current execution step
Stack & Memory
The Stack & Memory tab displays low-level EVM execution state:
opcode: the current opcode, updated with each stepcallStack: the call stack at the current stepstack: the EVM operand stackmemory: the EVM memory, cleared for each new message call
Breakpoints
Breakpoints can be added and removed by clicking on the line number in the Editor. When debugging, execution will jump to the first encountered breakpoint.
Important
If you add a breakpoint to a line that declares a variable, it might be triggered twice: once for initializing the variable to zero and a second time for assigning the actual value.
Here’s an example of this issue. If you are debugging the following contract:
pragma solidity >=0.5.1 <0.6.0;

contract ctr {
    function hid() public {
        uint p = 45;
        uint m;
        m = 89;
        uint l = 34;
    }
}
And breakpoints are set for the lines
uint p = 45;
m = 89;
uint l = 34;
then clicking the Next Breakpoint button will stop at the following lines in the given order:
uint p = 45;(declaration of p)
uint l = 34;(declaration of l)
uint p = 45;(45 assigned to p)
m = 89;(89 assigned to m)
uint l = 34;(34 assigned to l)